
The short answer
BSE began in 1875. The Sensex did not—and every major Sensex fall needs to be read through the risk that caused it.
The benchmark was launched in 1986 using 3 April 1979 as its base date. Since then, India has experienced fraud-led market breaks, imported financial contagion, valuation collapses, policy shocks, a systemic global credit crisis and a pandemic sudden stop.
The percentages are memorable. The mechanisms are investable. A valuation correction can leave the business intact; a solvency crisis can permanently destroy equity; a liquidity panic can reverse before reported economic data improves.
Historical records often mix intraday highs and lows with closing levels. The timeline below reproduces widely cited approximate cycle markers and labels the May 2004 event separately. It is designed to compare mechanisms—not to serve as an executable price database. Small differences from other publications are expected.
01 · The evidence map
Seven reversals that looked similar on a chart—and behaved differently underneath.
4,467 → 1,980 ≈ −56%
Securities scam, speculative excess and weaknesses in the bank–broker settlement chain
A crash that forced the market’s plumbing to change.~4,600 → ~3,300 ≈ −28%
Asian currency and financial crises; emerging-market risk reduction
Indian earnings were no longer the only variable setting Indian prices.5,937 → 3,404 ≈ −43%
Technology-bubble unwind alongside manipulation investigated by SEBI
A genuine technology revolution was converted into an indiscriminate pricing story.842-point intraday fall Two halts
Election result and fear of a sharp change in economic policy
A violent price shock without a broken banking or corporate system.~21,206 → 8,160 ≈ −62%
Global leverage, frozen funding markets, earnings cuts and foreign risk reduction
Profits, liquidity and valuation deteriorated together.~30,000 → 22,951 ≈ −24%
China fears, commodity weakness and stress in Indian bank assets
A serious repricing that did not become another global banking collapse.42,273 → 25,638 ≈ −39%
Pandemic shutdown, cash-flow uncertainty and a global dash for liquidity
One of the fastest collapses—and one of the fastest expectation-led reversals.Approximate peak/trough markers reconstructed from the cited BSE, SEBI, RBI and financial-journalism records. “Two halts” for May 2004 is a market-event description, not a peak-to-trough drawdown.
02 · BSE is not the Sensex
The exchange is 150 years old. The comparable benchmark history is much shorter.
BSE traces its establishment to 1875. The Sensex was launched on 2 January 1986, with a base date of 3 April 1979 and a base value of 100. Its 30 constituents are selected to represent large, liquid companies across key sectors and are weighted using free-float market capitalisation.
That distinction prevents an easy historical error: presenting 150 years of BSE history as 150 years of continuous Sensex performance. For cycle analysis, the credible series begins in the modern benchmark era.
A venue and market institution with rules, members, issuers and trading infrastructure.
A rules-based basket designed to measure a segment of the listed market.
Your return depends on the securities owned, price paid, costs, tax, behaviour and holding period.
03 · The case files
1992 changed the market. 2000 challenged valuation. 2008 tested survival.
When a crash exposes the plumbing
The Sensex rose to roughly 4,467 in April 1992 and fell toward 1,980 by April 1993. The Harshad Mehta episode became the symbol of the break, but the deeper weakness sat in the connections among banks, brokers, securities and settlement records.
The institutional response mattered. SEBI became a statutory body in 1992. India progressively expanded screen-based trading, depositories, rolling settlement, surveillance and clearer market access. The loss was real; so was the change in infrastructure that followed.
Investor lesson: market integrity is a return variable. If ownership, settlement or financing cannot be trusted, valuation work rests on a weak foundation.An Indian share can fall because global investors need cash elsewhere
The Asian financial crisis began with currency and balance-sheet stress across the region. The Sensex fell about 28% from roughly 4,600 to 3,300 even though the initiating fault line was not an Indian securities scam.
This was an early lesson in cross-border transmission. A foreign portfolio manager facing redemptions or a higher global risk premium can reduce Indian exposure even when a particular Indian company’s near-term earnings remain sound.
Investor lesson: price is set by the marginal buyer and seller. Global liquidity, currencies and portfolio positioning can overwhelm local fundamentals for a time.The technology thesis was right. “Any price” was wrong.
Software and the internet genuinely changed business. The error was converting a structural truth into a licence for indiscriminate valuation. The Sensex fell from roughly 5,937 in February 2000 to about 3,404 by October 2001.
India also faced manipulation around the 2001 market episode. SEBI’s Ketan Parekh orders document investigations launched after excessive volatility and actions against connected entities. The cycle therefore combined two risks that should not be blurred: an expensive theme and a market-integrity failure.
Investor lesson: a correct story does not rescue an impossible purchase price—and a rising price is not evidence that the market is clean.A crash-sized day that did not become a systemic bear market
After India’s general-election result, fear of a dramatic policy shift triggered extraordinary selling. SEBI’s adjudication record states that the Sensex fell 842 points intraday, closed 564.71 points lower and trading was suspended twice.
Yet banks had not suddenly become insolvent, global credit had not frozen and corporate cash flows had not disappeared overnight. As investors revised the probability of the most extreme policy outcomes, prices recovered quickly.
Investor lesson: the speed of a price move does not prove the depth of an economic impairment.The dangerous case: earnings, multiples and liquidity fall together
From the January 2008 region near 21,206 to the March 2009 closing low near 8,160, the reconstructed drawdown was roughly 61–62%. This was not simply an expensive market returning to normal.
Global financial institutions were deleveraging. Funding markets seized. Recession reduced earnings expectations. Foreign investors cut risk. The multiple applied to those lower earnings compressed as the required risk premium rose.
A 24% fall can be severe without being 2008 again
The Sensex moved from around 30,000 to 22,951 amid China concerns, commodity weakness, slower global growth and stress in Indian bank assets. The fall was uncomfortable; the financial system did not experience the same global funding seizure as 2008.
That distinction matters because “bear market” is a description of price, not a diagnosis of the balance sheet beneath it.
Investor lesson: use the percentage to measure pain; use credit, earnings and liquidity evidence to diagnose danger.The economy stopped first. Expectations turned before the data did.
The Sensex fell from an intraday record near 42,273 in January to roughly 25,638 in March—about 39% in little more than two months. Companies could not forecast demand because travel, retail activity and production were physically interrupted.
On 27 March 2020, RBI cut the policy repo rate by 75 basis points and separately announced up to ₹1 lakh crore of targeted long-term repo operations. Reopening expectations, financial support and reduced probability of a worst-case outcome helped markets recover while reported economic conditions remained poor.
Investor lesson: the market does not wait for the news to become good. It can turn when the distribution of possible outcomes becomes less bad.04 · What powered the rallies
A bull market can have four engines. Risk rises when only one is doing the work.
Earnings
Revenue, margins or capital efficiency improve. This is the most durable engine when cash follows accounting profit.
Re-rating
Investors pay a higher multiple for the same earnings. Powerful, but vulnerable to rates and expectations.
Liquidity
Falling rates, domestic savings or foreign flows increase demand for risk assets. Price may run ahead of fundamentals.
Recovery
The expected future improves from a depressed base. The rally can begin while reported data still looks terrible.
The 2003–07 rally combined strong growth, credit expansion, infrastructure investment, corporate earnings and global capital. Several engines fired together. By early 2008, that strength had also produced high expectations and crowded exposure—making the reversal more violent when the global credit system broke.
The most fragile rally is the one in which the price rise itself becomes the evidence used to justify the next purchase.
05 · Diagnose the drawdown
Six questions reveal more than the “correction” label.
| Mechanism | What is breaking? | Evidence to watch |
|---|---|---|
| Valuation | The price paid for each rupee of earnings | P/E dispersion, rates, risk premium, implied growth |
| Earnings | Expected cash-generating power | Estimate revisions, margins, orders, cash conversion |
| Liquidity | The market’s ability or willingness to finance risk | Credit spreads, fund flows, market depth, central-bank facilities |
| Leverage | The holder’s ability to stay invested | Margin calls, pledged shares, refinancing, forced selling |
| Integrity | Trust in trading, ownership or disclosure | Regulatory orders, settlement failures, related-party evidence |
| Policy | The expected rules or economic regime | Official decisions, fiscal path, taxes, regulation, probability—not rumours |
Three markets can each fall 25%. One may be an expensive market becoming reasonable. Another may be a temporary liquidity panic. The third may contain highly leveraged companies whose equity is being permanently impaired. The line on the chart cannot distinguish them for you.
06 · Drawdown mathematics
Loss and recovery are not mirror images.
| Starting capital | Drawdown | Capital left | Gain needed to recover |
|---|---|---|---|
| ₹1,00,000 | −20% | ₹80,000 | +25% |
| ₹1,00,000 | −40% | ₹60,000 | +66.7% |
| ₹1,00,000 | −60% | ₹40,000 | +150% |
A 60% fall does not need a 60% recovery. It needs 150%. That arithmetic does not mean an investor should avoid volatility at any cost. It means position size, liquidity needs and leverage must be chosen before the crash.
Use the AssetsNest Portfolio Risk Analyser to test what an equity drawdown would do to the whole allocation—not just the stock sleeve.
07 · Why recovery starts early
Markets discount the next set of cash flows, not the last GDP print.
A recovery can begin when conditions are still bad if the expected path stops worsening. Investors watch whether credit is reopening, liquidity stress is easing, earnings cuts are slowing and systemic failure is becoming less likely.
Reported activity describes the shock already experienced.
The probability of the worst scenario declines.
Investors accept a lower required return as uncertainty narrows.
Reported recovery confirms—or disproves—the market’s early move.
This is why “wait until the economy is healthy” can mean buying after a large part of the recovery. It is also why “buy immediately because it is down” is not analysis. The direction of expectations must be tested against financing and business survival.
08 · Anatomy of a market cycle
The trigger changes. The behavioural sequence often does not.
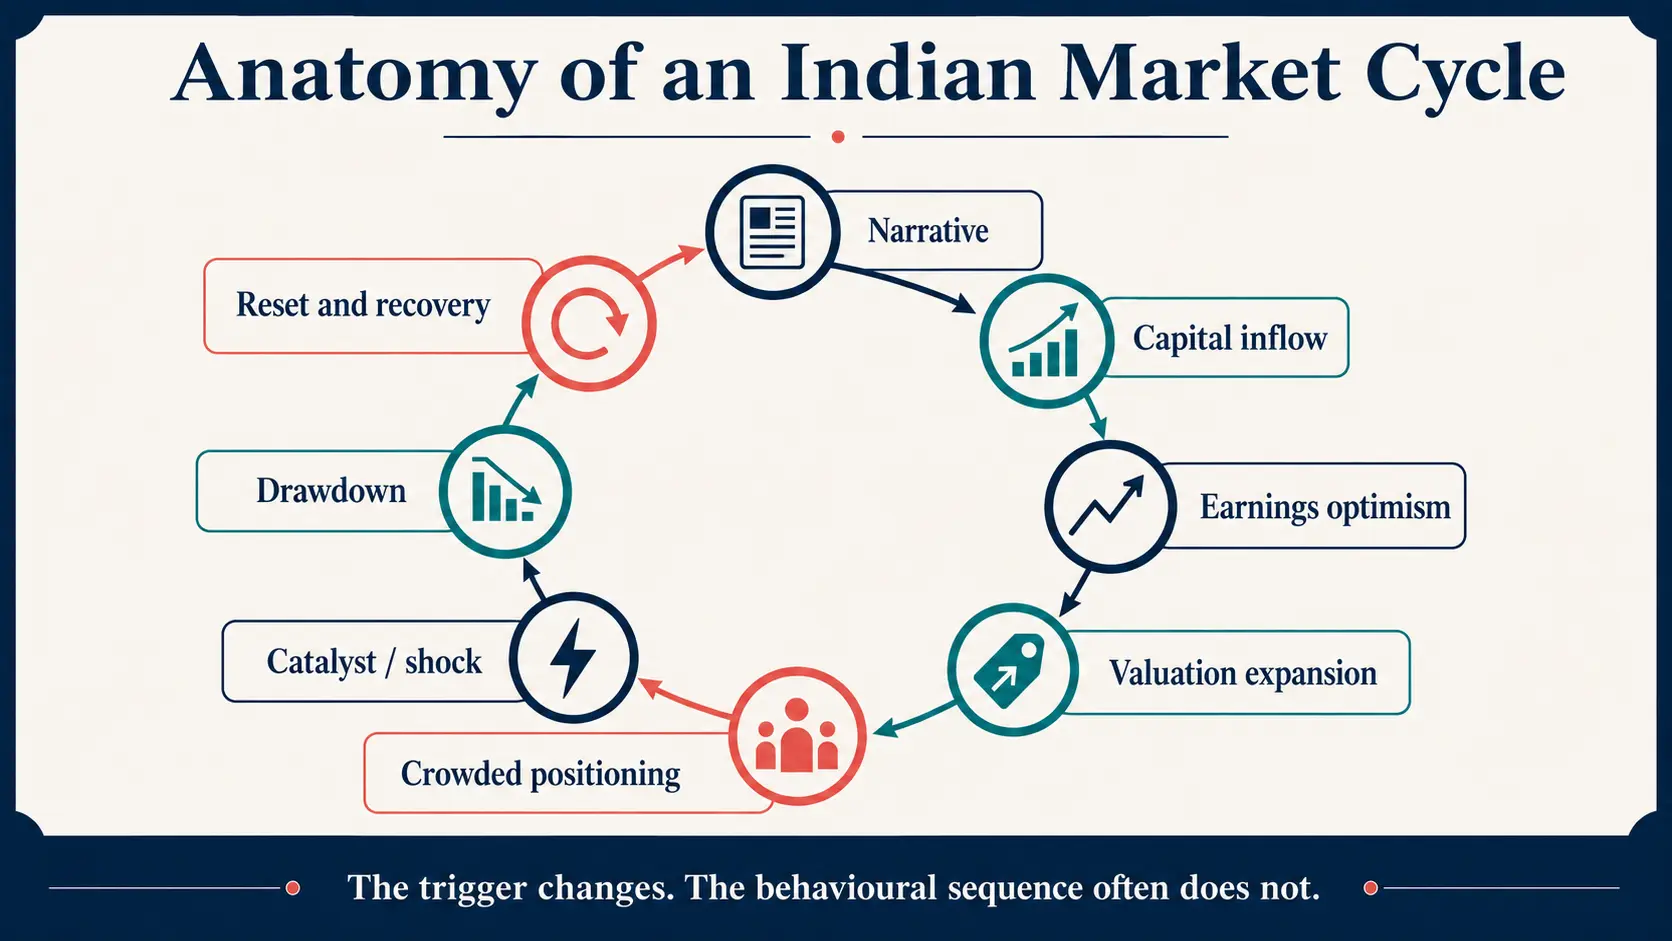
A structural opportunity attracts capital. Good results strengthen the story. Valuation rises, positioning crowds and the market becomes less tolerant of disappointment. A catalyst then exposes the vulnerability. Weak capital exits; surviving businesses and better prices create the conditions for the next cycle.
09 · Why the Sensex survived
Index resilience is partly economic growth—and partly institutional adaptation.
India’s listed market became more electronic, transparent and institutionally deep over these decades. Screen-based trading expanded, depositories replaced physical certificates, settlement accelerated and surveillance improved. Corporate India also became larger and more diverse.
But “the market always comes back” is the wrong conclusion. The Sensex changes constituents. A weak company can disappear while a stronger company enters. A leveraged investor can be forced to sell before recovery. A concentrated portfolio can remain impaired after the benchmark makes a new high.
An index recovery proves that the evolving basket recovered. It does not prove that every company, sector or investor did.
10 · Investor checklist
Twelve questions before calling a crash an opportunity.
- 01What caused the decline: valuation, earnings, liquidity, leverage, integrity or policy?
- 02Are analyst earnings estimates still falling—and by how much?
- 03Which companies need refinancing before cash flow can recover?
- 04Are credit markets functioning, or are lenders withdrawing?
- 05Is forced selling visible in pledged shares, margin positions or fund flows?
- 06How much of the previous peak depended on multiple expansion?
- 07Which sectors face permanent change rather than temporary disruption?
- 08What evidence would falsify the investment thesis?
- 09Can the portfolio tolerate another 20–30% fall without selling?
- 10Is near-term spending money separated from long-duration equity capital?
- 11Is the position size based on downside—or on confidence in the upside?
- 12What will be bought, at what valuation and in what sequence?
Conclusion
Crashes are part of the equity return—not an exception to it.
Sensex history does not prove that stocks are safe if an investor waits long enough. It shows why long-term equity returns demand the ability to endure uncertain cash flows, falling prices and periods when the future is unusually difficult to price.
The durable lesson is not “buy every dip.” It is to diagnose the mechanism, protect the ability to remain invested and distinguish temporary repricing from permanent business impairment.
The next time the market falls, ask first: what exactly is breaking?Frequently asked questions
BSE Sensex history, crashes and recoveries
When was BSE established?
BSE traces its establishment to 1875. It is older than the Sensex and should not be treated as though both histories began together.
When was the BSE Sensex launched?
The Sensex was launched on 2 January 1986. Its base date is 3 April 1979 and its base value is 100. It currently represents 30 large, liquid BSE-listed companies under a free-float market-capitalisation methodology.
What was the biggest Sensex crash?
Among the episodes covered here, the 2008–09 global financial crisis produced the deepest reconstructed peak-to-trough fall, roughly 61–62%. The exact percentage changes slightly with the selected intraday or closing observations.
How much did the Sensex fall during COVID-19?
Using the commonly cited intraday peak near 42,273 in January 2020 and trough near 25,638 in March 2020, the fall was about 39%. Close-to-close calculations produce a slightly different number.
Why can the Sensex recover before India’s economy?
A share price discounts expected future cash flows. The market can rise when investors judge that the probability of a worse outcome is falling—even while current GDP, employment or company data remain weak.
Is every 20% Sensex fall a buying opportunity?
No. A valuation reset, temporary liquidity shock and solvency crisis can all produce a similar chart. Valuation, earnings, leverage, credit conditions and the investor’s time horizon determine whether the fall is an opportunity or evidence of permanent impairment.
Does the Sensex recovering mean every stock recovers?
No. The index changes constituents over time. Companies can fail, dilute shareholders or remain below old peaks while stronger businesses take greater index weight. Index resilience is not a promise about an individual security.
Sources and methodology
What this Sensex history rests on
BSE and BSE Indices establish benchmark history and methodology; SEBI and RBI establish market structure, enforcement and policy response. Historical peak/trough markers use secondary reconstruction where a clean official daily series was not accessible. Reviewed 15 August 2026.
BSE — History and milestonesBSE established in 1875; the Sensex launched on 2 January 1986Open ↗BSE Indices — S&P BSE SENSEX factsheet30 constituents, 3 April 1979 base date, base value 100 and free-float methodologyOpen ↗SEBI — About SEBISEBI became a statutory body in 1992 under the SEBI ActOpen ↗SEBI — Indian securities-market historyDevelopment of screen-based trading, depositories and modern market infrastructureOpen ↗SEBI — Ketan Parekh orderInvestigation following excessive index volatility and the 2001 market episodeOpen ↗SEBI — May 2004 adjudication record842-point intraday Sensex fall, 564.71-point closing decline and two trading suspensionsOpen ↗RBI — Monetary Policy Statement, 27 March 202075-basis-point repo reduction and RBI assessment of pandemic market stressOpen ↗RBI — Targeted long-term repo operations₹1 lakh crore TLTRO framework responding to stress in equity, bond and foreign-exchange marketsOpen ↗Mint — Seven major Indian market crashesSecondary reconstruction of approximate historical peak and trough observationsOpen ↗AssetsNest research methodologyHow facts, calculations, inference and dated evidence are separatedRead →This article uses Indian benchmark history, rupee examples and primary records from BSE, SEBI and RBI. Local context appears only when it affects the evidence or investor decision.
AssetsNest Investor Services — ARN 318691. This article is for educational and informational purposes only. It is not personalised investment, legal or tax advice, an offer, recommendation or solicitation. Equity investments can lose capital. Historical index recoveries do not guarantee that a market, sector or security will recover in the same manner or timeframe. Evaluate suitability, valuation and risk independently and obtain qualified advice where appropriate.